Oscillatory Basis
for Consciousness
A neural-signal analysis investigating whether gamma phase synchronization across cortical regions provides an oscillatory basis for conscious experience, comparing awake and anesthetized states.
Searching for the rhythms a brain holds when it knows it's awake.
In recent years, there has been an increase in literature devoted to understanding the functional contributions of neural oscillations. It is suspected that synchronous neural oscillations that occur globally rather than locally give rise to conscious awareness (Ward, L.M., 2003). While there is research that explores whether the unresponsiveness that arises from anesthesia could be equivalent to unconsciousness, we work under the assumption that anesthesia induces an unconscious state (Alkire, Hudetz, Tononi, 2008).
Anesthesia is commonly used as a model of slow-wave sleep, as ketamine-xylazine anesthesia reproduces the main features of sleep slow oscillation. Slow waves are often associated with diminished consciousness even in the presence of high gamma activity (Chauvette et al., 2011; Murphy et al., 2011).
A survey of sleep research presents many relationships between different cortical areas, frequency bands, and stages of sleep and consciousness: most notably, the presence of theta oscillations in the cingulate cortex during wakefulness and REM sleep but not slow-wave sleep (Nishida et al., 2004). Wakefulness and N2/N3 stages of slow-wave sleep are characterized by slow delta oscillations. There is also high speculation as to whether conscious experience and a sense of agency arises from a gamma-synchronized dendritic web, also known as the conscious pilot (Hameroff, 2009).
So we ask: how do oscillations compare during sleep and wakefulness across brain regions? Are there neural correlates of consciousness, and if so, how do they manifest as neural oscillations?
Decomposing the signal into the frequencies that compose it.
3.1 Dataset
The dataset is from NeuroTycho's Anesthesia and Sleep Task, an experiment by Yanagawa, Chao, Hasegawa, and Fujii. ECoG data was extracted from monkey cortices, sampled at 1000Hz from three channels (cingulate, temporal cortex, and occipital cortex) from electrodes 52, 91, and 70 respectively. For 5 minutes, the monkey is awake with eyes open; for another 5 minutes, the monkey is anesthetized.
3.2 Methods & Parameter Decisions
The Fourier Transform converts the signal from time domain to frequency domain. We use it to find which frequencies contribute most during the awake state and compare to the anesthetized state by plotting the power spectral density, which displays the normalized power of each frequency.
STFT takes the Fourier transform at various windows across time, allowing us to plot the power of each frequency across time using a spectrogram. There is a known tradeoff between longer and shorter windows: temporal versus frequency resolution. We initially used a window size of 1 second and an overlap of 0.5 seconds as a standard measure. Upon noticing frequency-band spikes every 50 seconds, we also computed the spectrogram with a window of 5.0 seconds and overlap of 4.0 seconds, trading temporal for frequency resolution to see the spikes more clearly.
We applied a bandpass filter for each brainwave (delta, theta, alpha, beta, gamma), decomposing the signal into its components and comparing the awake and anesthetized states side by side, building a visual overview of how each band differs between states.
The Hilbert Transform provides the analytic signal via the Fourier Transform, omitting negative frequencies. It allows us to compute the instantaneous power signal of theta frequency through time to evaluate whether theta oscillations are regular and continuous across states.
We extracted the gamma component of each region for the awake state and plotted instantaneous phases on the same graph to visualize overlap. We then plotted synchrony between every pair of regions, plus average synchrony across all regions, and repeated the analysis on anesthetized data. The mean synchronization for each state quantifies whether the awake signal exhibits higher synchrony, the central question for whether gamma synchrony is indeed a basis for consciousness.
What each frequency band contributes, side by side.
The figure below shows the brainwave decomposition of the temporal lobe signal for both states. Each row isolates a single frequency band — delta, theta, alpha, beta, gamma — allowing direct comparison between awake and anesthetized conditions.
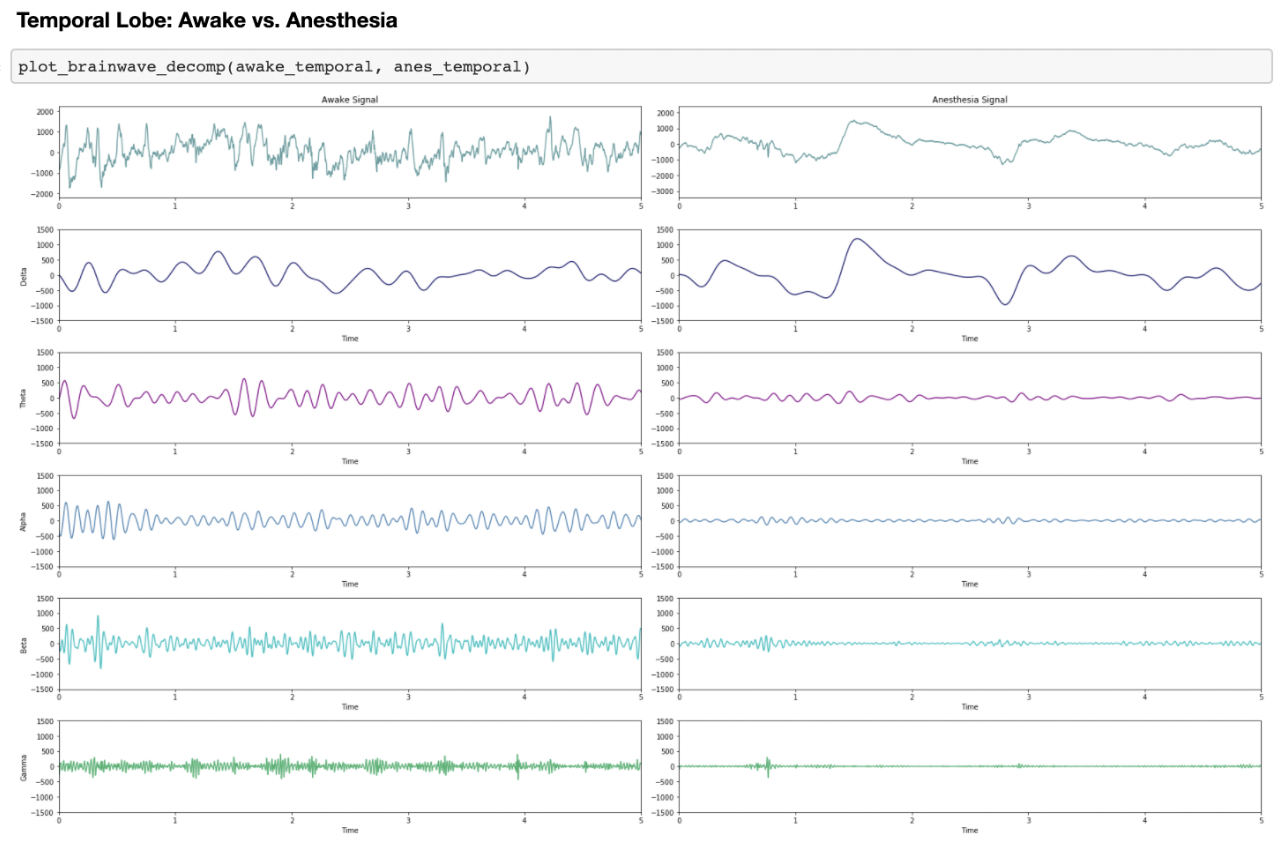
After filtering the signal into its band components, the delta component maintains higher amplitude in the anesthetized signal. All other components are noticeably smaller in amplitude when anesthetized. In the awake state, all frequency bands contribute to the signal somewhat uniformly. From the spectrogram and power spectral density we already know that lower frequencies contribute most during both states, but the decomposition clarifies that for the awake signal, every frequency contributes more than its anesthetized counterpart except for the delta component, consistent with the idea that delta (slow waves) contribute most during anesthesia. This pattern is also reflected in the occipital lobe.
In the cingulate region, each component appears to contribute equally across both states. However, one of our hypotheses was that the theta component would be regular and continuous in the awake signal and would not show the same continuity in the anesthetized signal. In the band-component plots, that difference is not visually obvious. The next step is the instantaneous power signal for theta oscillations specifically, which provides a more direct test of theta continuity through time.